Welcome
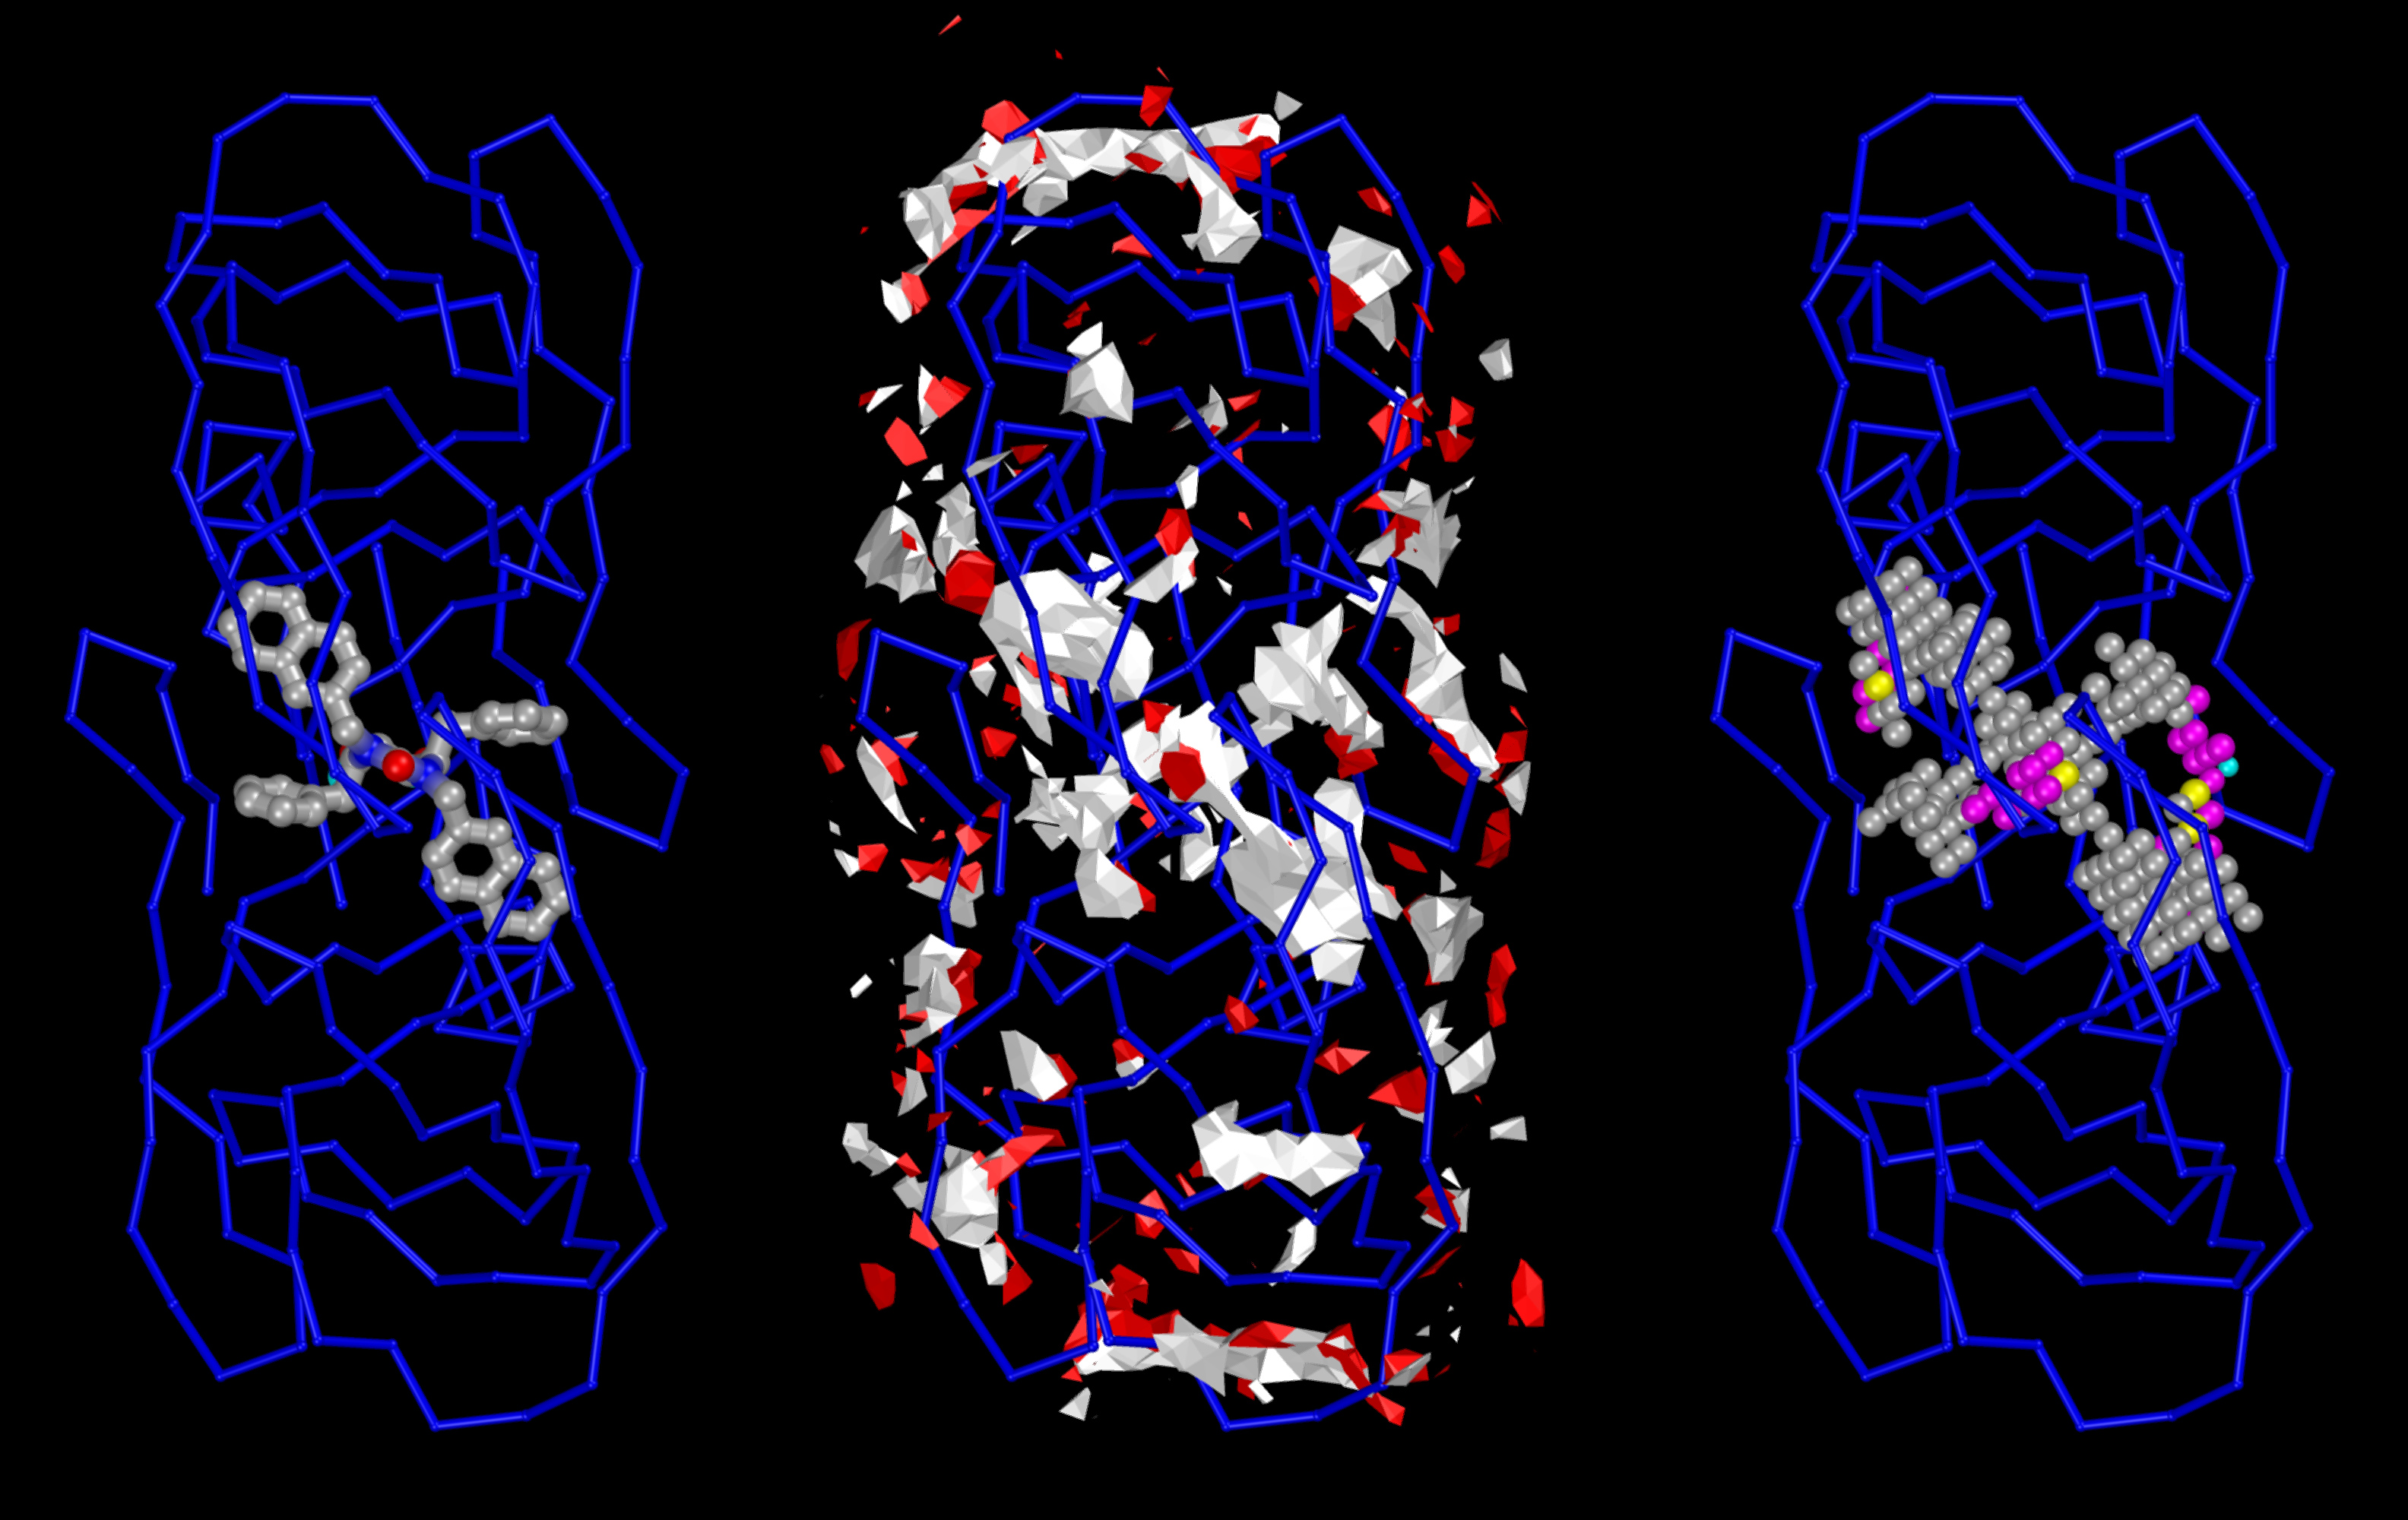
The Center for Computational Structural Biology (CCSB) currently comprises four highly synergistic and independently funded research laboratories focusing on a variety of aspect of modelling and simulating structural biology ranging from biomolecular visualization, computation and design, spanning from atomic structure and interactions to the mesoscale structure of living cells. It was created in 2018 as a successor of the Molecular Graphics Laboratory (MGL), founded by Arthur Olson in 1981. Over the years we have developed several freely-available software tools including AutoDock, Python Molecular Viewer, and CellPACK. Current applications include the design and virtual screening of covalent inhibitors of HIV-1 proteins, docking and binding energy prediction of small molecules and peptides to flexible biomolecular targets, and modeling of subcellular structures such as bacterial nucleoids and secretory vesicles.
Projects
Principal Investigators

Arthur J. Olson, Professor
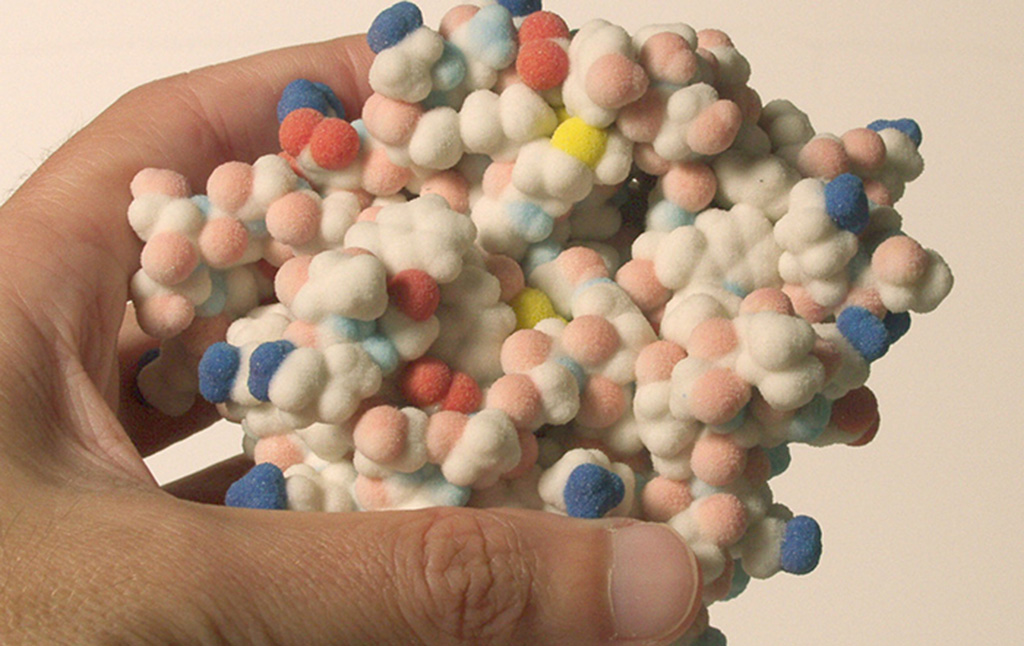
Arthur Olson has pioneered the use of computer graphics and simulation for the visualization and study of biomolecular structure and function.(faculty website)

Stefano Forli
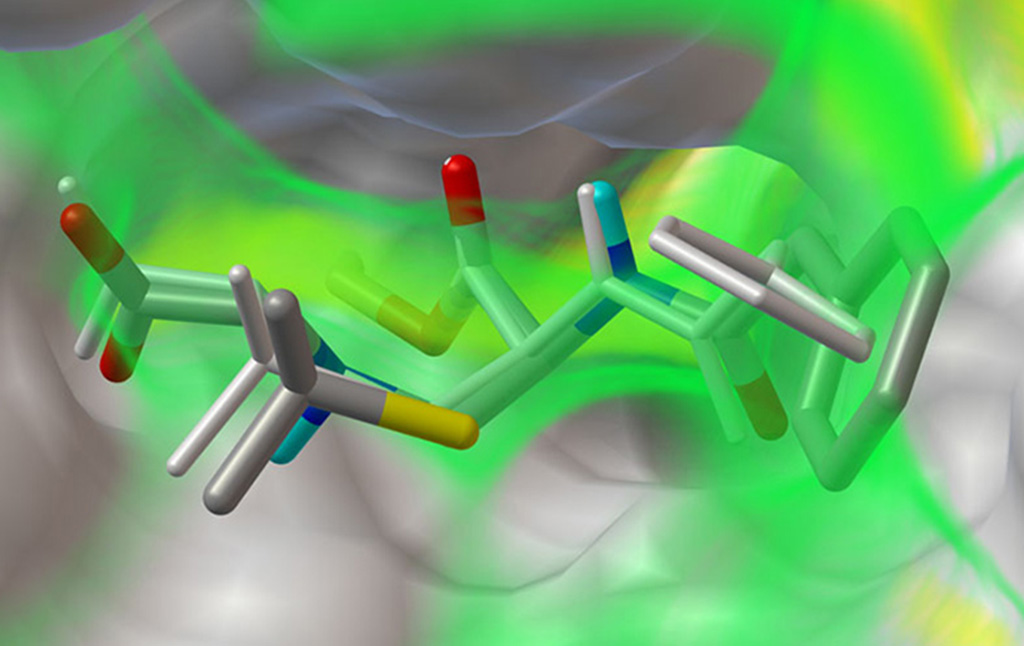
Stefano Forli is developing new methods for computational drug design, discovery, and virtual screening, and applying them to systems of biomedical interest such as HIV-1 infection and cancer. (Forli Lab)
David S. Goodsell
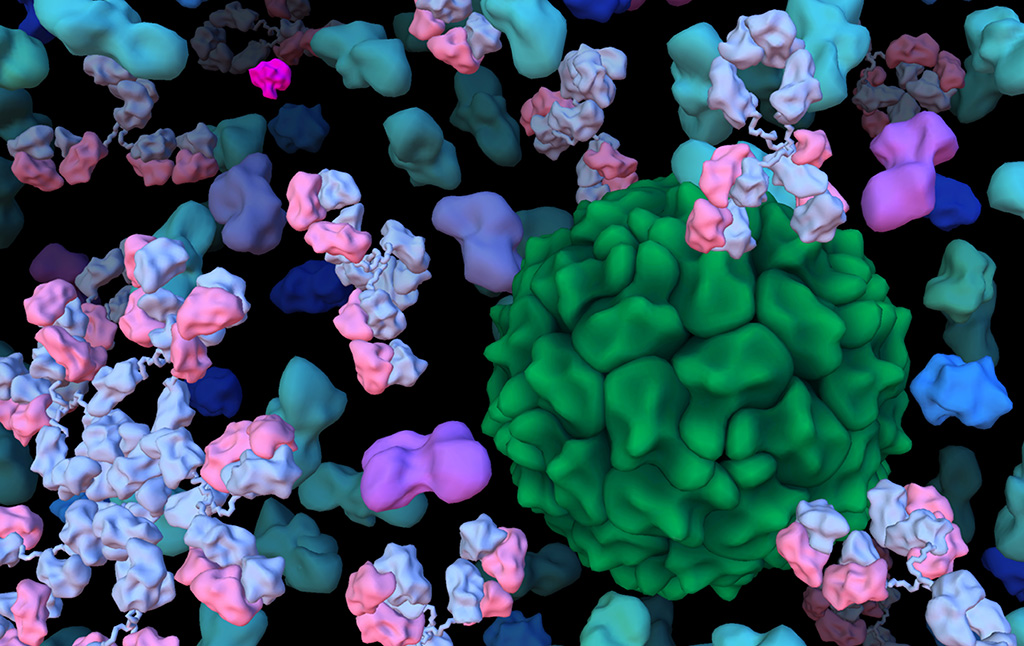
David Goodsell divides his time between computational modeling of the mesoscale structure of cells and science education at the RCSB Protein Data Bank. See more at his personal website.

Michel F. Sanner
Michel Sanner has pioneered a strategy for developing interoperable software components for the visualization and modelling of biomolecular interactions. He is also actively pushing the envelop of automated docking with new software such as AutoDockFR and AutoDock CrankPep. (faculty website).
News & Announcements
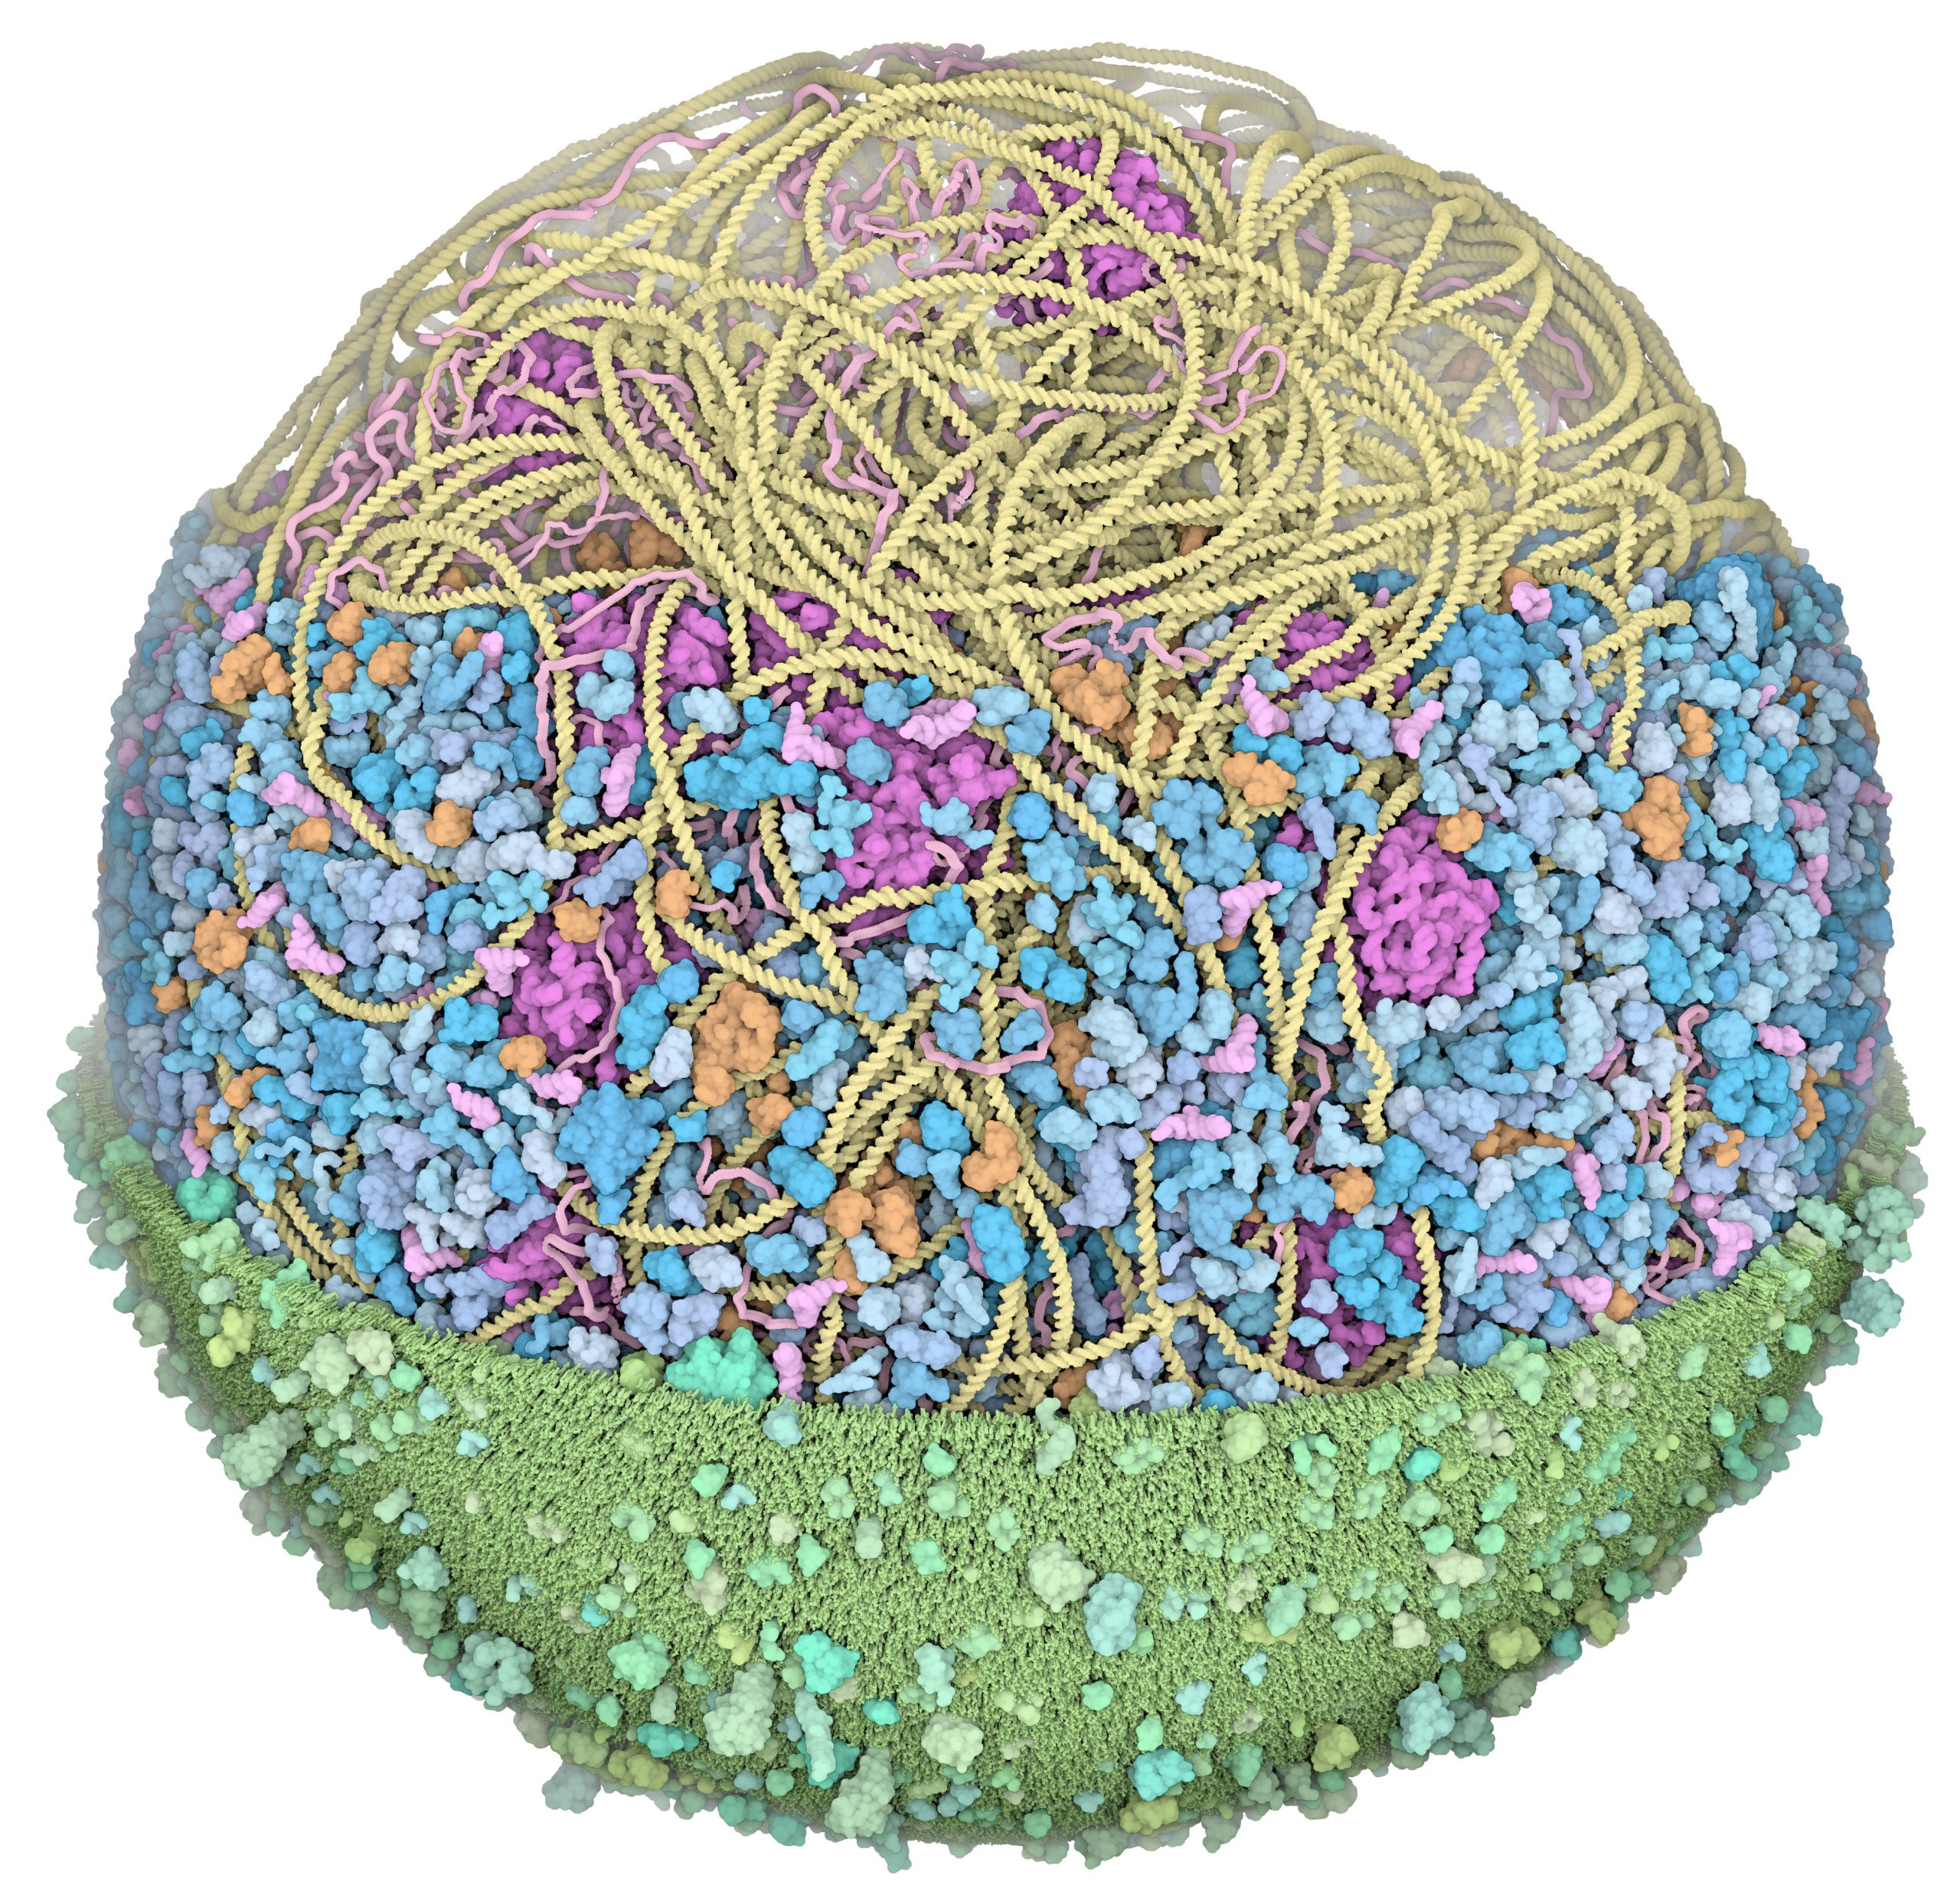
We presented the first structural model of an entire cell in the Journal of Molecular Biology article: ‘Building Structural Models of a Whole Mycoplasma Cell’, https://doi.org/10.1016/j.jmb.2021.167351. Click on the image for a gallery of images of the model, free for use under a Creative Commons license!